Your marketing team runs campaigns across Google Ads, LinkedIn, email, and organic search. A customer converts. Who gets the credit?
If you’re like 67% of B2B companies, you’re still using last-touch attribution—giving all the credit to whatever happened right before the sale. Meanwhile, you ignore the 26 other touchpoints that actually influenced the decision.
This is why multi-touch attribution exists. It distributes credit across the entire customer journey instead of picking arbitrary winners. But here’s what most guides won’t tell you: not all multi-touch attribution models work equally well, and some are actively misleading.
I’ve implemented attribution systems for SaaS companies, e-commerce brands, and B2B enterprises. The difference between a useful model and a useless one comes down to matching the model to your actual sales cycle. This guide shows you how.
What is Multi-Touch Attribution?
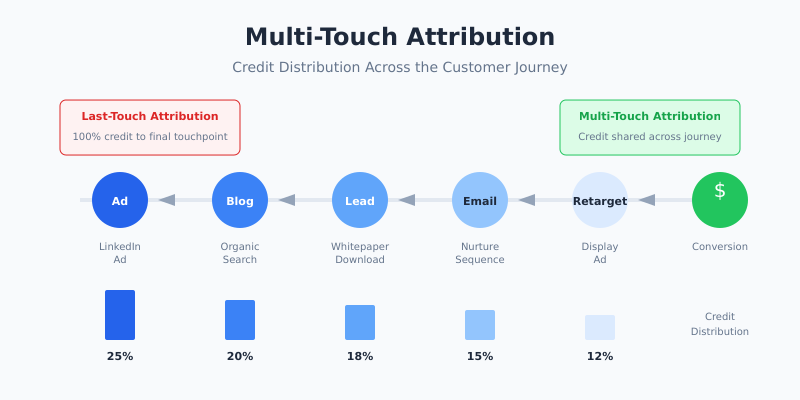
Multi-touch attribution (MTA) is a measurement approach that assigns conversion credit to multiple marketing touchpoints along the customer journey. Instead of crediting just the first or last interaction, MTA recognizes that buying decisions involve many influences.
Consider a typical B2B journey:
- 1 Prospect sees your LinkedIn ad
- 2 Visits your blog via organic search two weeks later
- 3 Downloads a whitepaper and enters your nurture sequence
- 4 Opens three emails over the next month
- 5 Clicks a retargeting ad
- 6 Books a demo and eventually purchases
Last-touch attribution would credit only the retargeting ad. First-touch would credit only LinkedIn. Both answers are incomplete. Multi-touch attribution tries to credit each touchpoint based on its actual contribution.
The Five Multi-Touch Attribution Models
There are five main approaches to distributing credit. Each has specific strengths and weaknesses.
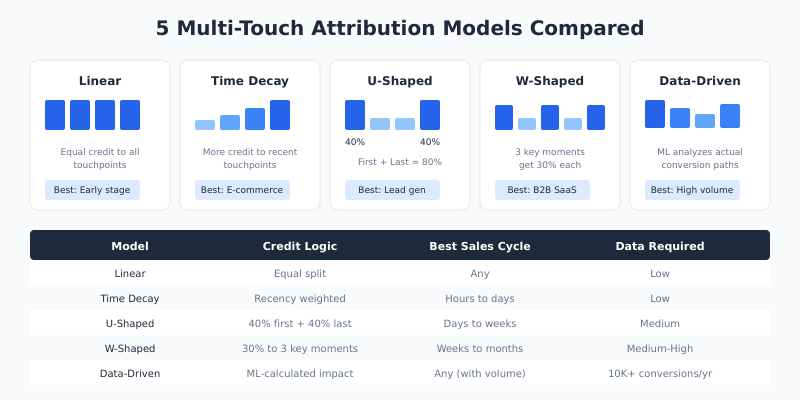
Linear Attribution
The linear model divides credit equally among all touchpoints. If six interactions led to a $6,000 deal, each touchpoint gets $1,000 in attributed revenue.
| Touchpoint | Credit |
|---|---|
| LinkedIn Ad | $1,000 (16.7%) |
| Organic Blog Visit | $1,000 (16.7%) |
| Whitepaper Download | $1,000 (16.7%) |
| Email Opens | $1,000 (16.7%) |
| Retargeting Ad | $1,000 (16.7%) |
| Demo Booking | $1,000 (16.7%) |
- ✓ Best for: Early-stage companies still learning which channels matter
- ✗ Weakness: Treats a casual blog visit the same as a demo request
Time Decay Attribution
Time decay gives more credit to touchpoints closer to conversion. The logic: recent interactions have more influence on the final decision. Touchpoints from weeks ago matter less than yesterday’s email click.
- ✓ Best for: Short sales cycles (e-commerce, impulse purchases)
- ✗ Weakness: Undervalues awareness campaigns that plant seeds early
U-Shaped (Position-Based) Attribution
The U-shaped model assigns 40% credit to the first touch, 40% to the last touch, and splits the remaining 20% among middle interactions. It recognizes that initial awareness and final conversion triggers deserve the most credit.
- ✓ Best for: Lead generation businesses where you need to track both acquisition and conversion
- ✗ Weakness: Ignores the nurturing phase that often determines deal size
W-Shaped Attribution
The W-shaped model distributes 30% each to three key moments: first touch, lead creation, and opportunity creation. The remaining 10% goes to other touchpoints. This model acknowledges that B2B journeys have distinct phases.
- ✓ Best for: B2B companies with defined funnel stages and CRM integration
- ✗ Weakness: Requires clear definitions of “lead” and “opportunity” stages
Data-Driven Attribution
Data-driven attribution uses machine learning to analyze conversion paths and assign credit based on statistical impact. It examines which touchpoint combinations actually correlate with conversions, rather than applying predetermined rules.
GA4’s data-driven attribution is now the default model and requires no manual configuration. However, it needs sufficient conversion volume to work properly—Google recommends at least 300 conversions and 3,000 ad interactions within 30 days.
- ✓ Best for: High-volume businesses (10,000+ annual conversions) with quality tracking
- ✗ Weakness: Black box—you can’t easily explain why specific touchpoints get credit
Which Model Should You Use?
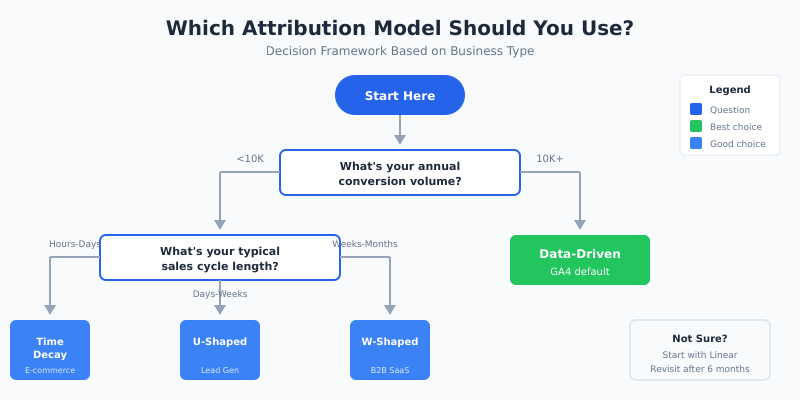
The right multi-touch attribution model depends on your business type, sales cycle, and data maturity. Here’s a practical decision framework:
| Business Type | Sales Cycle | Recommended Model |
|---|---|---|
| E-commerce (low AOV) | Hours to days | Time Decay or Data-Driven |
| E-commerce (high AOV) | Days to weeks | U-Shaped or Linear |
| B2B SaaS | Weeks to months | W-Shaped |
| Enterprise B2B | Months to year | W-Shaped + Custom weighting |
| High-volume any type | Any | Data-Driven |
If you’re unsure, start with linear attribution. It’s the simplest to understand and explain to stakeholders. Once you’ve collected 6+ months of data, you can evaluate whether a more sophisticated model reveals different insights.
How to Implement Multi-Touch Attribution
Implementation requires three components: consistent tracking, unified data, and proper tooling.
Step 1: Fix Your Tracking Foundation
Multi-touch attribution only works if you’re capturing touchpoints accurately. Before choosing a model, audit your current setup:
- ✓ UTM parameters on all campaign links (consistent naming conventions)
- ✓ Cross-domain tracking configured if you use multiple domains
- ✓ User ID tracking to connect anonymous sessions to known users
- ✓ Conversion events firing correctly (test with Google Tag Manager debug mode)
Missing even one channel means your attribution data tells an incomplete story.
Step 2: Connect Your Data Sources
Most businesses have touchpoint data scattered across platforms: Google Analytics, CRM, email platform, ad networks. For accurate multi-touch attribution, this data needs to be unified.
Options range from simple to complex:
- → Simple: Use GA4’s built-in attribution (limited to Google ecosystem)
- → Intermediate: Export data to Looker Studio with blended data sources
- → Advanced: Build a data warehouse with tools like BigQuery and connect all sources
Step 3: Choose Your Attribution Tool
Your tooling depends on budget and technical resources. Most companies start with what they already have before investing in dedicated solutions.
For most marketing teams, GA4’s attribution reports provide sufficient insight. The Model Comparison report lets you see how different models would credit your channels, helping you decide which approach fits your business.
If you need cross-platform attribution that includes offline touchpoints or CRM data, dedicated tools like HubSpot’s attribution reporting or enterprise solutions like Salesforce Marketing Cloud provide more comprehensive views.
Step 4: Set a Lookback Window
The lookback window defines how far back you’ll consider touchpoints. A 30-day window means you ignore any interaction more than a month before conversion.
Match your lookback window to your sales cycle:
- → E-commerce: 7-30 days
- → B2B SaaS: 30-90 days
- → Enterprise: 90-180 days
Too short and you miss important early touchpoints. Too long and you attribute credit to interactions that didn’t actually influence the decision.
When Multi-Touch Attribution Fails
MTA isn’t a perfect solution. Understanding its limitations helps you interpret results correctly.
The Offline Blindspot
Multi-touch attribution tracks digital interactions. If customers see your billboard, hear your podcast ad, or get a recommendation from a friend, those touchpoints don’t appear in your data. For businesses with significant offline marketing, MTA tells only part of the story.
The Cookie Problem
With increasing privacy restrictions, cross-device and cross-browser tracking becomes harder. A customer who researches on mobile but converts on desktop may appear as two separate journeys. Safari’s ITP and Firefox’s Enhanced Tracking Protection limit cookie lifespan to 7 days or less.
The Correlation Trap
Attribution shows correlation, not causation. Just because someone clicked a retargeting ad before converting doesn’t mean the ad caused the conversion—they might have purchased anyway. For true causality, you need incrementality testing: running controlled experiments to measure lift.
The Walled Garden Issue
Facebook, Google, and LinkedIn each report their own attribution numbers. Predictably, each platform claims more credit than a unified view would assign. When you compare platform-reported conversions to your actual sales, the total often exceeds 100%.
Multi-Touch Attribution vs. Other Approaches
MTA is one of three main measurement approaches. Understanding all three helps you build a complete picture.
| Approach | What It Measures | Best For |
|---|---|---|
| Multi-Touch Attribution | Which touchpoints appear in conversion paths | Tactical channel optimization |
| Media Mix Modeling (MMM) | Statistical relationship between spend and outcomes | Strategic budget allocation |
| Incrementality Testing | Causal impact via controlled experiments | Validating channel effectiveness |
The most sophisticated marketing teams use all three. MTA guides daily optimizations, MMM informs quarterly planning, and incrementality tests validate assumptions.
Common Multi-Touch Attribution Mistakes
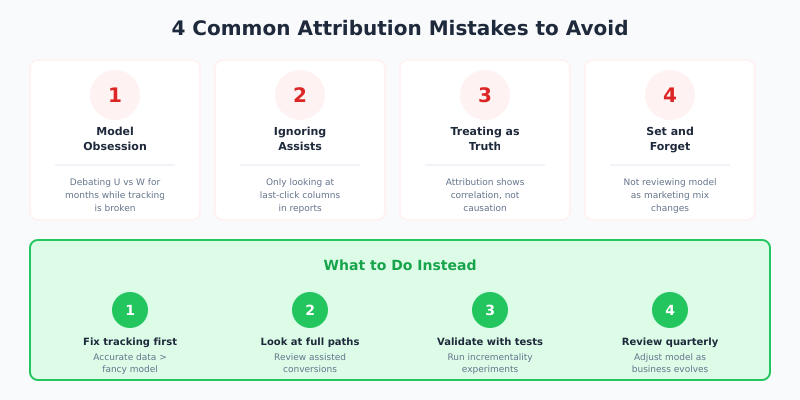
After auditing dozens of attribution setups, these errors appear repeatedly:
1. Obsessing Over Model Perfection
Teams spend months debating whether U-shaped or W-shaped is “correct.” Meanwhile, their tracking is broken, UTMs are inconsistent, and half their conversions aren’t being recorded. Fix data quality first. A simple model with accurate data beats a sophisticated model with garbage inputs.
2. Ignoring Assisted Conversions
Many marketers still focus only on “last-click” columns in their reports. The whole point of multi-touch attribution is recognizing that channels assist conversions even when they don’t close them. Display advertising rarely converts directly—but it might appear in 40% of your conversion paths as an assist.
3. Treating Attribution as Truth
Attribution models are frameworks for thinking about credit allocation, not objective reality. No model perfectly captures how humans make decisions. Use attribution to inform decisions, but validate with other methods before making major budget shifts.
4. Setting and Forgetting
Your marketing mix changes. New channels emerge. Customer behavior shifts. Attribution models need periodic review. What worked in 2024 might mislead you in 2026.
FAQ
What is the difference between multi-touch and single-touch attribution?
Single-touch attribution assigns all conversion credit to one touchpoint—either the first interaction (first-touch) or the last interaction (last-touch). Multi-touch attribution distributes credit across multiple touchpoints in the customer journey. Single-touch is simpler but less accurate for complex buying journeys.
How much data do I need for data-driven attribution?
Google recommends at least 300 conversions and 3,000 ad interactions within 30 days for GA4’s data-driven model. For custom machine learning models, you typically need 10,000+ conversions annually to achieve statistical significance. With less data, rule-based models like linear or U-shaped work better.
Can multi-touch attribution track offline conversions?
Standard MTA tracks digital touchpoints only. To include offline interactions, you need to import offline conversion data into your analytics platform, matching it to online user identities. This requires CRM integration and consistent user identification across channels—possible but technically complex.
Which attribution model does Google Ads use?
Google Ads defaults to data-driven attribution for conversion tracking, assuming you have sufficient conversion volume. You can switch to other models (last-click, first-click, linear, time-decay, position-based) in your conversion settings. Note that Google’s attribution only counts Google touchpoints—it doesn’t credit Facebook or LinkedIn.
How often should I review my attribution model?
Review your attribution setup quarterly and whenever you add significant new channels or change your conversion tracking. Major shifts in your marketing mix or customer journey warrant a fresh evaluation. Compare model outputs to identify if a different approach would provide more useful insights.