What Are A/B Testing Metrics?
A/B testing metrics are the specific measurements you use to decide whether a test variation beats your control. They’re the numbers that tell you if a change actually worked — or if you just got lucky.
I’ve run hundreds of A/B tests over the past decade. The biggest lesson? Picking the wrong metric is worse than not testing at all. It leads teams to ship changes that hurt revenue while celebrating “wins” that never existed.
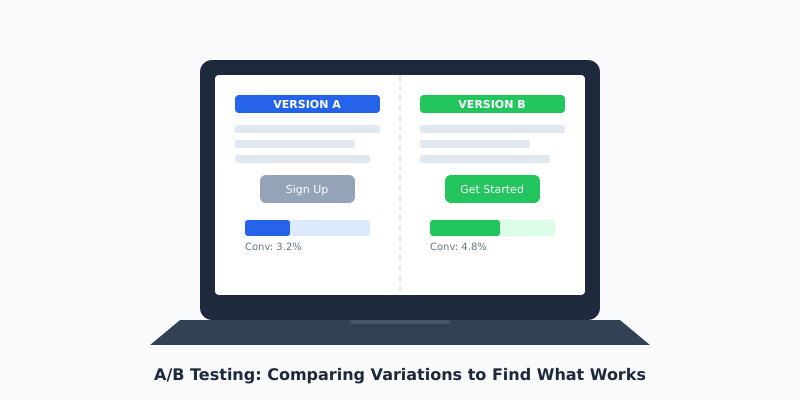
At its core, every A/B test compares two versions of something. Version A is your control. Version B is the challenger. The metrics you choose determine which one wins. Get this decision wrong, and everything downstream falls apart.
Here’s what surprises most people: the test itself is the easy part. Tools like Optimizely, VWO, and Google Optimize handle the mechanics. The hard part is knowing what to measure and when to trust the results.
Primary vs Secondary Metrics
Every test needs one primary metric. Just one. This is the number that decides the winner. If you try to optimize for three metrics at once, you’ll optimize for none of them.
Your primary metric should connect directly to business value. For an e-commerce site, that’s usually revenue per visitor. For a SaaS landing page, it might be free trial signups. For a content site, it could be email subscriptions.
Secondary metrics are guardrails. They don’t decide the winner, but they warn you if something’s going wrong. Here’s how I categorize them:
- → Primary metric: The single KPI that determines the test winner (e.g., conversion rate, revenue per visitor)
- → Secondary metrics: Supporting indicators that validate your primary result (e.g., average order value, pages per session)
- → Guardrail metrics: Safety checks to ensure you’re not breaking something else (e.g., bounce rate, error rate, load time)
I’ve seen teams celebrate a 15% increase in click-through rate while ignoring a 20% drop in actual purchases. The CTR was the primary metric, but it shouldn’t have been. Always tie your primary metric to the business outcome you actually care about.
The Metrics That Actually Matter
Not all metrics deserve your attention. After years of running tests for clients across e-commerce, SaaS, and media, I’ve narrowed it down to the metrics that consistently predict real business impact.
Conversion Rate
This is the percentage of visitors who complete your desired action. It’s the most common A/B testing metric for good reason — it’s simple and directly tied to outcomes. If you’re testing a checkout flow, your conversion rate is orders divided by visitors.
Revenue Per Visitor (RPV)
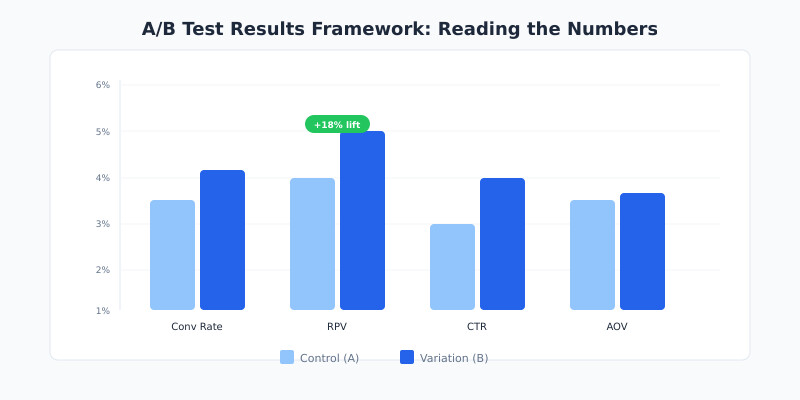
I prefer RPV over conversion rate for e-commerce tests. Why? Because a variation might increase conversion rate by 10% while decreasing average order value by 15%. RPV captures both effects in one number. It’s calculated as total revenue divided by total visitors.
Click-Through Rate (CTR)
CTR measures how often users click a specific element. It’s useful for testing headlines, CTAs, and navigation elements. But here’s the catch — a higher CTR doesn’t guarantee more revenue. Use it as a primary metric only when clicks are the direct business goal.
Bounce Rate
Bounce rate tells you the percentage of visitors who leave without interacting. It’s best used as a guardrail metric. If your test variation drops bounce rate but doesn’t move conversions, the “engagement” isn’t meaningful.
Customer Lifetime Value (CLV)
This is the advanced metric most teams overlook. As Nielsen Norman Group notes, short-term test results can mislead you about long-term customer value. A discount-heavy variation might convert more visitors today but attract deal-seekers who never return.
- ✓ Use revenue per visitor as your primary metric for e-commerce tests
- ✓ Use conversion rate for lead generation and signup flows
- ✓ Use CTR only when clicks are the direct business objective
- ✓ Always include bounce rate and page load time as guardrail metrics
- ✓ Track CLV when possible to catch long-term effects
Statistical Significance: When to Trust Your Results
Statistical significance is the mathematical confidence that your test result isn’t random noise. In practice, it answers one question: “If I ran this test again, would I get a similar result?”
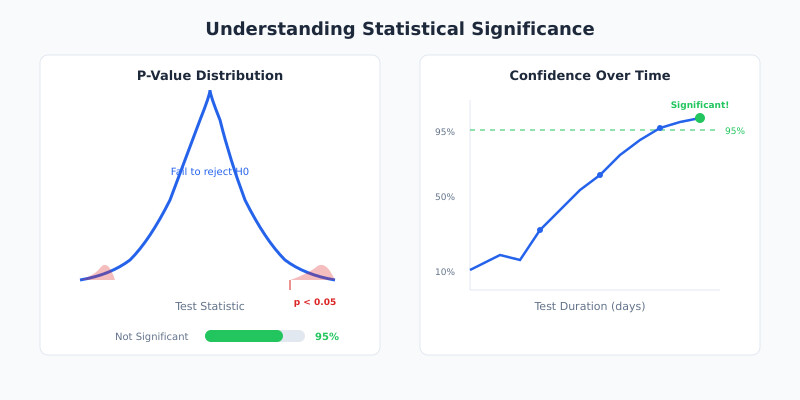
The industry standard is 95% statistical significance. This means there’s only a 5% chance your result happened by random chance. Some teams push for 99%, but for most business decisions, 95% is sufficient.
Here’s how it works. Your testing tool calculates a p-value — the probability that you’d see results this extreme if there were no real difference between variations. A p-value below 0.05 means your result is statistically significant at the 95% level.
But statistical significance alone isn’t enough. I’ve seen tests reach 95% significance with a 0.3% lift in conversion rate. That’s statistically real but practically meaningless. You need to evaluate both statistical and practical significance — whether the improvement is large enough to matter for your business.
Tools like ABTestGuide’s significance calculator and Convert’s statistical significance guide can help you understand these calculations without a statistics degree.
- ◆ A 95% significance level means a 5% chance of a false positive — not a 95% chance the winner is better
- ◆ Large sample sizes can make tiny, meaningless differences appear “significant”
- ◆ Always pair statistical significance with a minimum detectable effect (MDE) you set before the test
Sample Size and Test Duration
The most common A/B testing mistake I see? Stopping tests too early. Someone sees a 20% lift after two days and ships the change. A week later, the lift evaporates. This is called peeking, and it inflates your false positive rate dramatically.
Before you start any test, calculate the required sample size. You need three inputs:
- 1 Baseline conversion rate — your current conversion rate for the metric you’re testing
- 2 Minimum detectable effect (MDE) — the smallest improvement worth detecting (typically 5-20%)
- 3 Statistical power — the probability of detecting a real effect (standard is 80%)
For example, if your baseline conversion rate is 3% and you want to detect a 15% relative improvement (from 3% to 3.45%), you’ll need roughly 35,000 visitors per variation. At 1,000 visitors per day, that’s about 70 days — over two months.
This is where many teams get uncomfortable. They want answers in a week. But rushing leads to unreliable results. As a rule of thumb, I recommend running tests for a minimum of two full business cycles (usually two weeks) regardless of sample size, to capture weekly patterns in user behavior.
The research from Invesp confirms this: you should aim for at least 200-300 conversions per variation as an absolute minimum. Anything less, and your results are unreliable.
Common Measurement Mistakes
I’ve audited dozens of testing programs. These mistakes show up in almost every one.
1. Using Too Many Primary Metrics
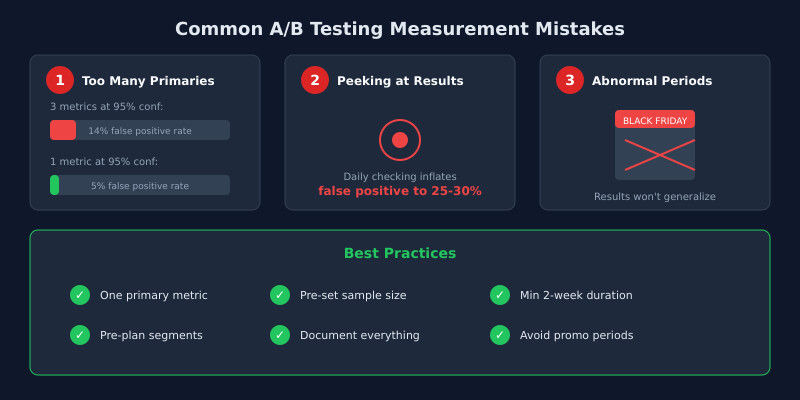
When I run tests for clients, I enforce a strict rule: one primary metric per test. Multiple primaries increase your false positive rate through a problem called multiple comparisons. Testing three primary metrics at 95% significance gives you a roughly 14% chance of at least one false positive instead of 5%.
2. Peeking at Results
Checking results daily and stopping when they look good inflates your false positive rate to 25-30%. Decide your sample size before starting. Don’t stop early. If you must monitor tests in progress, use sequential testing methods designed for continuous monitoring.
3. Ignoring Segment Differences
A test might show no overall effect, but perform dramatically differently for mobile vs desktop users. Always segment your results by device, traffic source, and customer type. But beware — segment analysis should be pre-planned, not a post-hoc fishing expedition.
4. Confusing Correlation with Causation
A variation that increases time on page doesn’t necessarily increase revenue. More time might mean users are confused, not engaged. Always connect micro-metrics back to macro-outcomes.
5. Running Tests During Abnormal Periods
Holiday traffic, sales events, and product launches distort test results. I always advise clients to pause tests during Black Friday and other promotional periods. The traffic composition shifts so dramatically that results won’t generalize to normal conditions.
According to Contentsquare’s guide on A/B testing metrics, teams that establish clear measurement frameworks before running tests see significantly better outcomes than those who decide what to measure after the fact.
Reading Test Results: A Practical Framework
When a test concludes, don’t just look at the winner badge in your testing tool. Use this framework I’ve developed over years of client work to properly evaluate results.
Step 1: Check Statistical Significance
Is the result above your predetermined significance threshold (typically 95%)? If not, the test is inconclusive. That’s a valid result — it means the change didn’t produce a detectable effect.
Step 2: Evaluate Practical Significance
Is the lift large enough to matter? A 0.5% improvement in conversion rate might be statistically significant with enough traffic, but it probably won’t move the business needle. Calculate the expected revenue impact before deciding.
Step 3: Review Guardrail Metrics
Did any guardrail metrics degrade? A test that increases signups by 10% but increases page load time by 2 seconds will likely hurt you long-term. Check bounce rate, error rate, load time, and any other guardrails you established.
Step 4: Examine Segments
Look at pre-planned segments. Does the variation work equally well across mobile and desktop? New and returning visitors? If it only works for one segment, consider a targeted rollout rather than a full deployment.
Step 5: Document and Decide
Record the test hypothesis, metrics, sample size, duration, and results. I’ve worked with teams running VWO and Optimizely who lost years of institutional knowledge because nobody documented test outcomes. Build a testing repository from day one.
- ✓ Set your success criteria before the test starts, never after
- ✓ Calculate expected revenue impact, not just percentage lifts
- ✓ Treat inconclusive results as valid findings worth documenting
- ✓ Build a shared testing repository so your team learns from every experiment
FAQ
What is the most important A/B testing metric?
Revenue per visitor (RPV) is the most reliable primary metric for most commercial tests. It captures both conversion rate changes and average order value shifts in a single number. For non-commercial goals like lead generation, conversion rate works well. Always pick the metric closest to your actual business objective rather than a proxy metric like clicks or page views.
How long should I run an A/B test?
Run tests for at least two full weeks to capture weekly behavioral patterns, and until you reach your pre-calculated sample size. Most tests need 2-8 weeks depending on traffic volume. Never stop a test early because results look promising — early results are unreliable due to the peeking problem, which inflates your false positive rate significantly.
What does 95% statistical significance actually mean?
It means there’s a 5% probability that you’d observe results this extreme if there were no real difference between variations. It does not mean you’re 95% sure the winner is better. This distinction matters because even at 95% significance, roughly 1 in 20 winning tests will be false positives. Pair it with practical significance to make sound decisions.
Can I use multiple primary metrics in one A/B test?
I strongly recommend against it. Each additional primary metric increases your false positive rate through the multiple comparisons problem. If you test three primary metrics at 95% significance, your actual false positive probability rises to about 14%. Instead, pick one primary metric and track others as secondary guardrails to watch for negative side effects.
What is a minimum detectable effect and why does it matter?
The minimum detectable effect (MDE) is the smallest improvement you’d consider worth implementing. It determines your required sample size — smaller effects need larger samples to detect reliably. Setting your MDE before the test prevents you from chasing tiny, meaningless gains. For most tests, a 5-20% relative improvement is a practical MDE range.